The 25 Best Teams In The Tournament (Say Stat Geeks)
March 16, 2016 – by Seth Trachtman
Here at TeamRankings, we’ve developed a sophisticated solution of strategy plus technology for winning NCAA bracket pools. From the minute the 2016 NCAA bracket was announced on Selection Sunday, we’ve been making our objective predictions for the NCAA tournament by gathering and analyzing many sources of data on every team. These include:
Power ratings from multiple top predictive systemsBetting oddsInjury reportsLineups & playing time distribution trends
Late last night, we fed our data-driven predictions, along with the latest data on public picking trends in this year’s bracket pools, to a server farm of 18 high-powered computers over at Amazon. Overnight and through today, those computers have been running software we wrote to perform millions of simulations of the 2016 NCAA tournament, as well as simulations of fictional bracket pools of different sizes and scoring systems.
The end results are our official 2016 NCAA bracket picks (check them out here): simulation-tested brackets that are algorithmically optimized for your pool’s size and scoring system.
Last year, based on an analysis of how our picks did in over 1,300 different bracket pools, customers using our brackets won prizes up to 5 times as often as you’d expect from an average opponent in their pool.
Objective data is the heart and soul of our bracket pick optimization process, and since we spend a bunch of time gathering and reviewing team ratings data from multiple different sources, we pd we’d publish some of the highlights.
The 2016 NCAA Tournament Stat Geek Top 25
The table below represents data from five sources:
TeamRankings.com (that’s us)Ken PomeroyESPN’s BPIPredictionMachineLRMC
The table gives you a quick visual sense of where each team is ranked, and of the level of agreement between different ratings systems. We’ve included the top 25 teams in the 2016 NCAA tournament, as measured by average ranking (not rating) across all five systems (the “Avg.” column). Just click on the image to enlarge it.
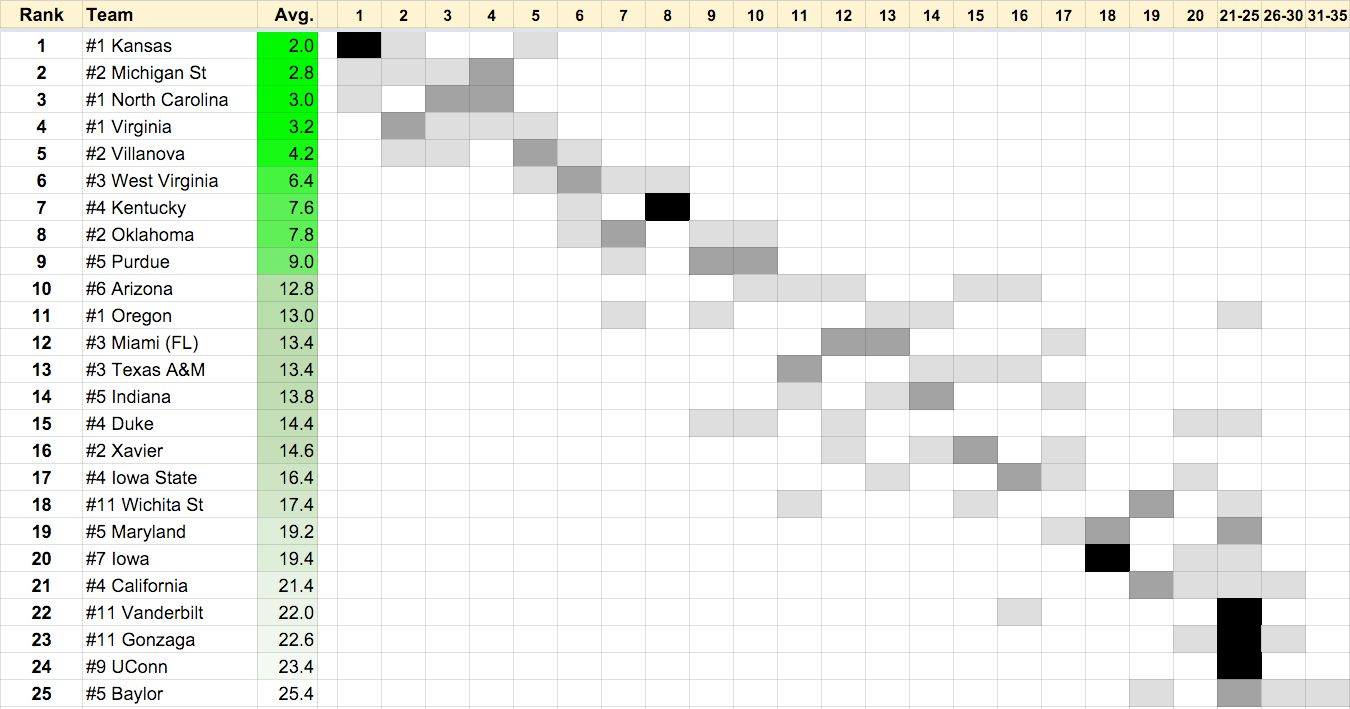
How To Interpret The Table
Rank numbers are listed across the top, from left to rightIf one of the five systems gave team a certain rank, there’s a light gray box in the corresponding cellIf multiple sites gave a team at the same rank, the gray box is darker
(Note that postseason-banned teams Louisville and SMU were eliminated from these rankings, so the teams behind them moved up one or two spots as a result in each ranking.)
Highlights From The Data
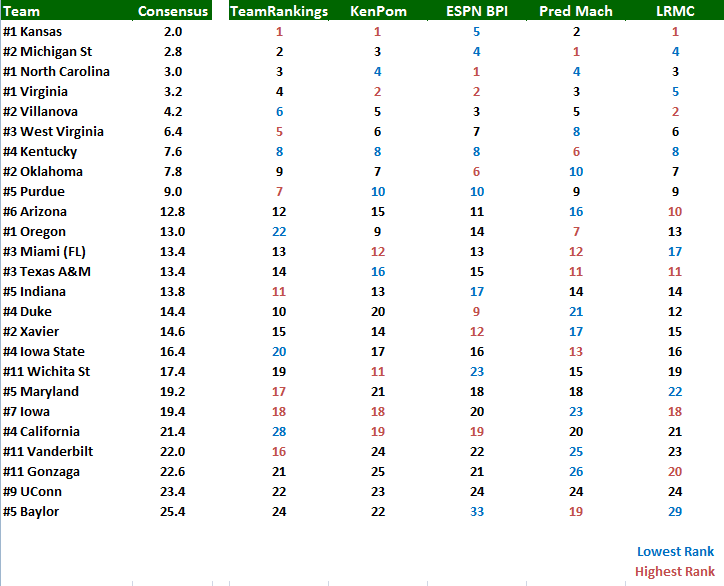
Kansas has 3 of 5 votes as the No. 1 team in the tournament, but their average ranking is dragged down by an outlier, a 5th place ranking from ESPN’s BPIDespite being a #2 seed, Michigan State is ranked as the second best overall team, with no ranking less than No. 4. Prediction Machine ranks Michigan State as the No. 1 team in the field.Oregon is the lowest ranked #1 seed in the tournament, with an average ranking of 13.0 across all five systems. However, there is huge disagreement on the Ducks across systems, from a high of No. 7 (Prediction Machine) to a low of #22 (TeamRankings).There are no less than three #11 seeds in the top 25 (Wichita State, Vanderbilt, and Gonzaga), and no system ranked any of them worse than No. 26. So if these “stat geek rankings” determined seed numbers, these three teams would all be deserving of a #6 seed or better. Two of them, Wichita State and Vanderbilt, faced off in a play-in game last night; tough draw for Vandy.Other outliers of interest include ESPN’s BPI having Duke as the No. 9 team in the tourney, while KenPom and Prediction Machine have them at No. 20 and 21, respectively; #11 Wichita State as the No. 11 team in the field by KenPom, and #5 Purdue being ranked as the No. 9 team in the field with very high consistency across systemsThe highest seed number to get snubbed? #3 Utah didn’t even crack the Top 25.
Here’s the full set of data that the chart was based on. We evaluated all of these data points, and thousands more, as part of our process to give you the best chance to win your NCAA pool.
If you liked this post, please share it. Thank you! Twitter Facebook
NFL Football Pool Picks NFL Survivor Pool Picks NCAA Bracket Picks College Bowl Pool Picks College Football Pool Picks NFL Picks NBA Picks MLB Picks College Football Picks College Basketball Picks NFL Predictions NBA Predictions MLB Predictions College Football Predictions College Basketball Predictions NFL Spread Picks NBA Spread Picks MLB Spread Picks College Football Spread Picks College Basketball Spread Picks NFL Rankings NBA Rankings MLB Rankings College Football Rankings College Basketball Rankings NFL Stats NBA Stats MLB Stats College Football Stats College Basketball Stats NFL Odds NBA Odds MLB Odds College Football Odds College Basketball Odds A product ofTeamRankings BlogAboutTeamJobsContact
© 2005-2024 Team Rankings, LLC. All Rights Reserved. Statistical data provided by Gracenote.
TeamRankings.com is not affiliated with the National Collegiate Athletic Association (NCAA®) or March Madness Athletic Association, neither of which has supplied, reviewed, approved or endorsed the material on this site. TeamRankings.com is solely responsible for this site but makes no guarantee about the accuracy or completeness of the information herein.
Terms of ServicePrivacy Policy